Building a Stats Page
With the rebirth of personal sites as a content platform, I’ve seen a lot of people making a page dedicated to different statistics about their sites. I figured it was time for me to get in on the action.
When I first thought to do this, I wasn’t sure what stats to include. I don’t have analytics on my site as I question the privacy implications. The only initial thought I had was posts per year. That was something I could easily gather given that all my posts are in a single folder and all of them have their date in both their filename and their metadata.
Posts by Year
The first task was to get a list of all my posts, this is pretty simple since I already do this to load my posts.
export const getStats = (): Stats => {
    const posts = getAllPosts();

    return {
        PostsPerYear: [],
    };
};
The next step was to go through the posts and break down the years and the number of posts per year.
const getPostYear = (postDate: string): number => parseInt(postDate.substring(0, 4), 10);

export const getPostsPerYear = (posts: BlogPost[]): PostsPerYear[] => {
    const allYears = posts.map((p) => getPostYear(p.date.toString()));

    const years = [...new Set(allYears)];

    const postsPerYear: PostsPerYear[] = [];

    for (let i = 0; i < years.length; i += 1) {
        postsPerYear.push({
            year: years[i],
            count: posts.filter((p) => getPostYear(p.date.toString()) === years[i]).length,
    }

    return postsPerYear;
};
The first thing I do is get a list of the years from all the posts. There will be a lot of duplicates here, so I use JavaScript’s Set object to create a unique list.
An Aside
const years = [...new Set(allYears)];By passing in an array to the Set constructor, and spreading it into an array, it will remove duplicates and create a distinct list...quite useful.
Back to the Point
At this point I have an array of years with their associated number of posts
[
	{ year: 2013, count: 11 },
	{ year: 2014, count: 14 },
	...
	{ year: 2023, count: 6 }
]
So at this point, my stats.ts library file looks like this:
export const getStats = (): Stats => {
    const posts = getAllPosts();

    return {
        PostsPerYear: getPostsPerYear(posts),
    };
};
I then can take that data and pass it into a component to create a nice graphic. More on that later.
Most Popular Tags
While working on the years, I realized that when I converted my site to run on [Next.js], I added tags to all of my posts. While there are many tags I’ve used, I figured the ten most popular could be a good item to show.
This one was going to prove to be a little more challenging. For reference, each blog post has an array of tags for it.
[
    { name: 'Reading Log', url: 'reading-log' },
    { name: 'Twitter', url: 'twitter' },
    { name: 'C#', url: 'csharp' },
    { name: '.NET', url: '.net' },
    { name: 'CSS', url: 'css' },
    { name: 'Unit Testing', url: 'unit-testing' },
    { name: 'NASA', url: 'nasa' },
    { name: 'JWST', url: 'jwst' }
]
This is an example from my [Reading Log - January 20 (#15)] post. Each tag has 2 properties. The display name, and the URL slug that corresponds to it. I’ve toyed with trying to auto-generate it, but this has worked for me thus far.
To find the tags most commonly used, I wanted to create an array of tags with their associated post count.
[
	{ name: "Reading Log", url: "reading-log", count: 42 },
	{ name: "Life", url: "life", count: 40 },
	...
	{ name: "Monthly Check-In", url: "monthly-check-in", count: 16 }
]
By default, I only wanted the top 10 posts, so I put a limit on the function call and defaulted it to 10. I’m not sure if I’ll use this elsewhere so I figured I’d make it a little extensible.
const getPopularTags = (posts: BlogPost[], limit = 10): PostsPerTag[] => {
    const postsPerTag: PostsPerTag[] = [];
    let tagArray: BlogTag[] = [];

    for (let i = 0; i < posts.length; i += 1) {
        const { tags } = posts[i];

        tagArray = [...tagArray, ...tags];
    }

    const uniqueTags = [...new Set(tagArray.map((t) => t.url))];

    uniqueTags.forEach((tagUrl) => {
        postsPerTag.push({
            name: tagArray.find((t) => t.url === tagUrl).name,
            url: tagUrl,
            count: tagArray.filter((t) => t.url === tagUrl).length,
        });
    });

    return postsPerTag.length <= limit
        ? postsPerTag
            .sort((a, b) => b.count - a.count)
        : postsPerTag
            .sort((a, b) => b.count - a.count)
            .slice(0, limit);
};
The way the function works is it goes through all the posts and adds all the tags to a giant array. I then use the same Set command to trim that array to unique tags based on the URL slug. From there, I go through each unique tag and create the array of tags with their associated post count.
At the very end I return either the entire array sorted by post count descending, or the first ten posts sorted. That gets sent to component to be rendered on the page.
export const getStats = (): Stats => {
    const posts = getAllPosts();

    return {
        PostsPerYear: getPostsPerYear(posts),
        MostPopularTags: getPopularTags(posts),
    };
};
Putting It All Together
The final step was to build by stats page.
On the stats page, the first thing I want to do is retrieve the stats in the getStaticProps() call.
export const getStaticProps: GetStaticProps = async () => {
    const stats = getStats();

    return {
        props: {
            stats,
        },
    };
};
Returning that to the page I then created 2 components to display the stats in chart form.
<h2>Posts Per Year</h2>
<PostsPerYearCharts stats={stats.PostsPerYear} />

<hr className={styles.statsSeparator} />

<h2>Most Popular Tags</h2>
<MostPopularTagsChart stats={stats.MostPopularTags} />
Posts Per Year
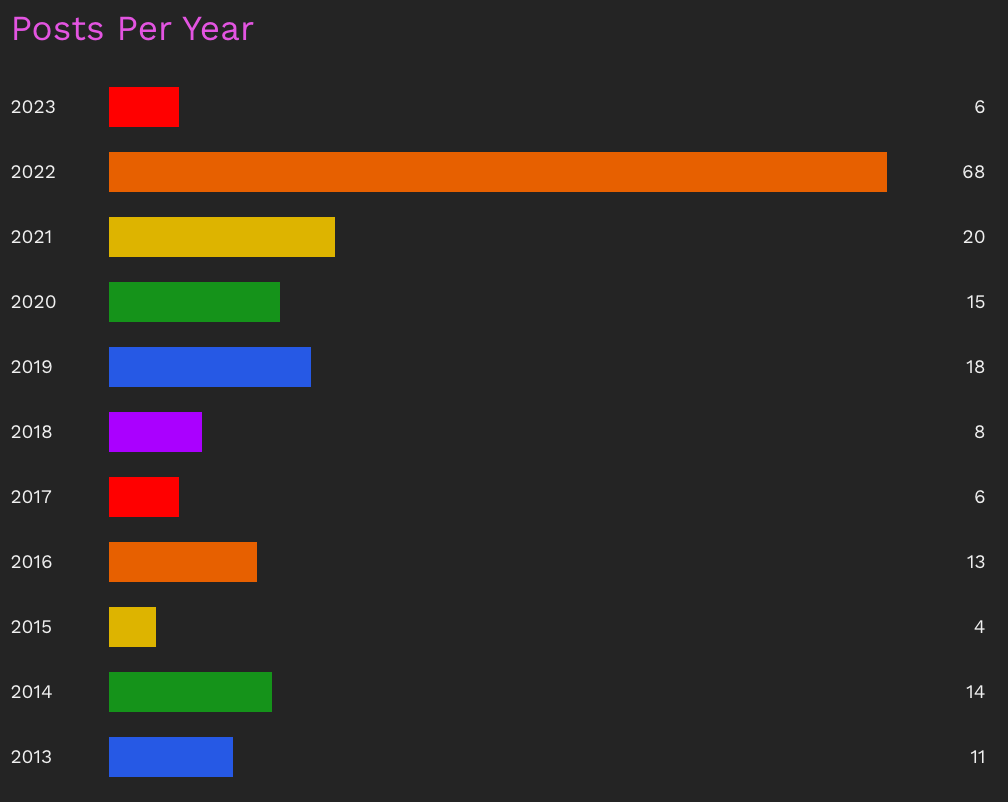
Let’s first look at the posts per year chart.
The first thing I’ll need to do is to transform the data into something I can use to display on the page. I’ve stolen the CSS from my goal progress page for the charts. Basically I have some div elements that span the full width of the chart container. I opted to have the year with the most posts span the full width and have all the other years span a percentage based on that.
So the first thing I need to do is figure out the year with the highest post count, or more specifically, what that post count is. There might be a more efficient way to do this, but at this point, this’ll do. I go through each year in the stats object and check to see if the count is greater than the current max. If it is, I re-assign the value to max, if it isn’t, I move on. Once all years are looped through, I just return the highest number that will be assigned to the max variable.
const getMaxCount = (): number => {
    let max = 0;

    for (let i = 0; i < stats.length; i += 1) {
        const { count } = stats[i];

        if (count > max) {
            max = count;
        }
    }

    return max;
};
The next step will be to create the data for the graph. Typescript conveniently allows you to extend interfaces, so I created a new type based on the PostsPerYear type.
interface PostsPerYearGraph extends PostsPerYear {
    percentage: number;
    color: string;
}
I end up with a type that is defined as:
interface PostsPerYearGraph {
    year: number;
    count: number;
    color: string;
    percentage: number;
}
Now let’s build the data.
const availableColors = [
    '#ff0000',
    '#e76000',
    '#ddb400',
    '#15931a',
    '#2659e5',
    '#aa00ff',
];

const calculateData = () => {
    const maxCount = getMaxCount();

    const chartData: PostsPerYearGraph[] = [];

    let colorIdx = 0;

    for (let i = 0; i < stats.length; i += 1) {
        const { year, count } = stats[i];

        if (colorIdx >= availableColors.length) {
            colorIdx = 0;
        }

        chartData.push({
            year,
            count,
            color: availableColors[colorIdx],
            percentage: Math.round((count / maxCount) * 100),
        });

        colorIdx += 1;
    }

    setYearData(chartData);
};
You can see at the beginning of calculateData() I get the max number using the getMaxCount function defined above. I then create an empty array for the chart data. I go through the years and add the data to that array. The 2 complications are that I want separate colors for each bar, and that I need to calculate the width of the bar.
The color I calculate by having a second loop through an array of colors I wish to use. In this case, it’s the rainbow (save for indigo)! The percentage is a math calculation. What I want for the percentage is “What is the percentage of the current year of the highest count?” In this case I divide the count by the max and multiply by 100, and then round it using the Math.round function.
I can then take the data and pass it into the JSX to render to the screen.
<div className={styles.mainContainer}>
{yearData.map((d) => (
<div key={d.year} className={styles.container}>
<p className={styles.barTitle}>{d.year}<span className={styles.mobileStats}> ({d.count})</span></p>
<div className={styles.bar}>
<div className={styles.innerBar} style={{ backgroundColor: d.color, width: `${d.percentage}%` }} />
</div>
<p className={styles.barLegend}>{d.count}</p>
</div>
))}
</div>Here I loop through the yearly data returned by the calculateData() function and create the different bars. I use the inline styles to define both the width and the backgroundColor for the bar.
The end result looks nice.
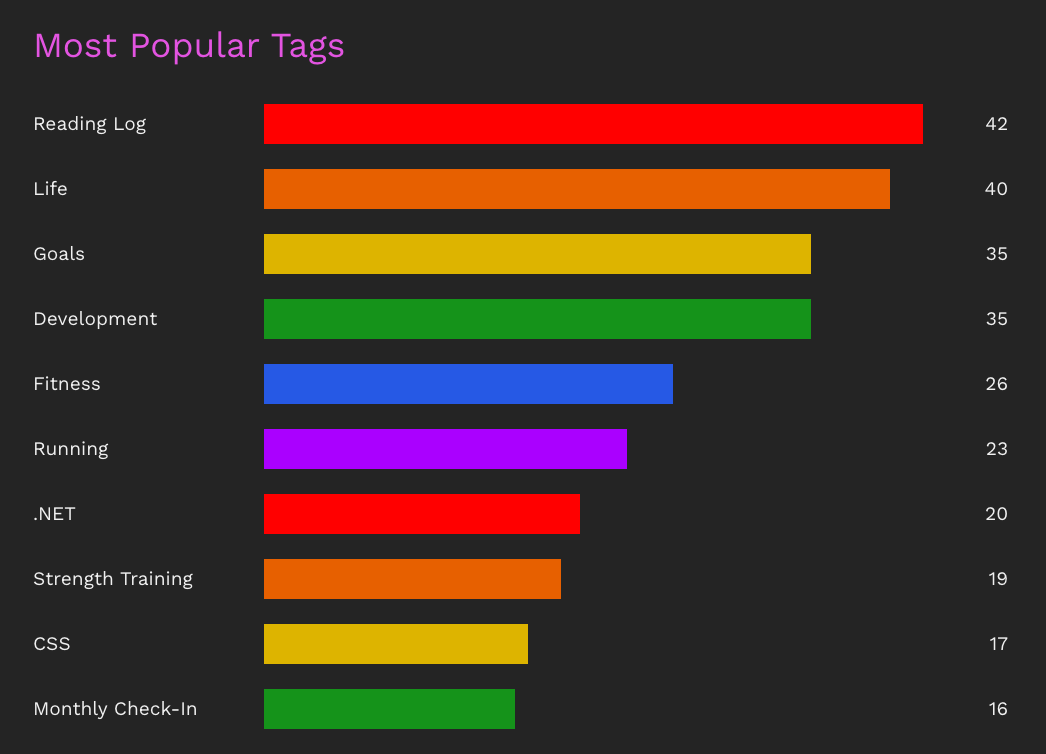
Most Popular Tags
The popular tags charts is almost an exact duplicate. The only difference is that I also assign the URL slug of the tag to the data so that clicking on the tag name on the graph would take the user to the appropriate page showing all posts with the given tag.
const availableColors = [
'#ff0000',
'#e76000',
'#ddb400',
'#15931a',
'#2659e5',
'#aa00ff',
];
const getMaxCount = (): number => {
let max = 0;
for (let i = 0; i < stats.length; i += 1) {
const { count } = stats[i];
if (count > max) {
max = count;
}
}
return max;
};
const calculateData = () => {
const maxCount = getMaxCount();
const chartData: MostPopularTagsGraph[] = [];
let colorIdx = 0;
for (let i = 0; i < stats.length; i += 1) {
const { name: tag, url, count } = stats[i];
if (colorIdx >= availableColors.length) {
colorIdx = 0;
}
chartData.push({
name: tag,
url,
count,
color: availableColors[colorIdx],
percentage: count === maxCount ? 100 : Math.round((count / maxCount) * 100),
});
colorIdx += 1;
}
setTagData(chartData);
};
useEffect(() => {
calculateData();
}, []);
return (
<div className={styles.mainContainer}>
{tagData.map((d) => (
<div key={d.name} className={styles.container}>
<p className={styles.barTitle}>
<Link href={`/tag/${d.url}`}>
<a>{d.name}</a>
</Link>
<span className={styles.mobileStats}> ({d.count})</span>
</p>
<div className={styles.bar}>
<div className={styles.innerBar} style={{ backgroundColor: d.color, width: `${d.percentage}%` }} />
</div>
<p className={styles.barLegend}>{d.count}</p>
</div>
))}
</div>
);The end result is very similar.
It was a fun little project. You can view the full page here.
Also, as a reminder, you can view the code to my blog on GitHub.
Feel free to reach out to me through the comments or on Mastodon.